General
An overview of the location of the controls on the views is given in https://hexagon.atlassian.net/wiki/x/AwAxago.
Colour codes
Information displayed on different controls but related to each other is shown in the same colour
Colour codes in the flight guidance control
|
Colour |
Relationship |
Examples |
|---|---|---|
|
Red
|
Information about the current line |
|
|
Cyan |
Information about the aircraft |
|
|
Blue |
Information about the line to be flown next |
|
Colour codes in the graphical presentation showing the line status
|
Line Status |
Line label |
Line representation |
||
|---|---|---|---|---|
|
North-up view |
Nose-up view |
In-flight eval. |
||
|
Successfully flown |
|
Dotted grey line |
Green line |
|
|
Flown with warnings |
|
Dotted grey line |
Warning part orange |
|
|
Flown with errors |
|
Dotted grey line |
Warning part red |
|
|
Flown but user set recording OFF |
|
Thin black line |
Not recorded part thick black |
|
|
Not yet flown |
|
Thin black line |
Thin black line |
|
|
Next line |
|
Thick blue line |
Thick blue line |
|
|
Line in execution |
|
Thick red line |
Thick red line |
|
Wind control
The wind control shows wind direction, wind speed and wind direction relative to the aircraft.
Note: The wind control is only displayed if Leica FlightPro is configured to take wind into account. Configuration see section https://hexagon.atlassian.net/wiki/spaces/FPDOC/pages/45283804009/6.3.1%2B2%2BSoftware%2BGlobal1%2BConfiguration#Configuration-of-Flight-Guidance-%26-Sensor-Release-Configuration-options.
The wind direction is defined according to definitions in weather reports.
The yellow background indicates user setting of the parameters.
Wind direction is 176° (Wind is coming from South)
Wind speed is 14 kts
The grey background indicates automatic wind detection by Leica FlightPro.
The red triangle indicates the wind direction relative to the aircraft.
The aircraft is slightly rotated to the left. The rotation angle is equal the angle between the aircraft’s heading and the aircraft’s track
Note: If the wind Icon is displayed without any numbers, there’s either too little wind or Leica FlightPro needs more time to complete the wind direction or wind speed calculation.
Track and line direction control
The track and line direction control shows current track in a cyan frame and the line direction in a red frame.
Important: A flight line must be selected for the line direction control to display information. For a non-planned line only the track information is displayed.
Important: All directions are in true north by default.
Shown in cyan frame: current track 031.1°
Shown in red frame: line direction 026.1°
Track and line direction are displayed in True North
The horse shoe symbol displayed on the left side of each frame indicates that track and line direction are displayed with magnetic variation. See section https://hexagon.atlassian.net/wiki/spaces/FPDOC/pages/45283804009/6.3.1%2B2%2BSoftware%2BGlobal1%2BConfiguration#Configuration-of-Flight-Guidance-%26-Sensor-Release-Configuration-options.
Track deviation control
The track deviation control shows the aircraft’s deviation from the suggested flight path. Units are shown in the control.
Important: A flight line must be selected previously so that track deviation can display information.
The aircraft position is about 1,000 m left of the suggested flight path.
The aircraft position is precisely on the suggested flight path.
The aircraft position is about 500 m right of the suggested flight path.
Configuration of the track deviation control see section https://hexagon.atlassian.net/wiki/spaces/FPDOC/pages/45283804009/6.3.1%2B2%2BSoftware%2BGlobal1%2BConfiguration#Configuration-of-Flight-Guidance-%26-Sensor-Release-Configuration-options.
Position Control
The position control shows current position, Sun elevation and time in UTC
Example: Position is displayed in WGS84 coordinates.
Example: Position is displayed in local coordinates.
Configuration of display of Position control to display the position either in WGS84 or in local coordinates see section https://hexagon.atlassian.net/wiki/spaces/FPDOC/pages/45283804009/6.3.1%2B2%2BSoftware%2BGlobal1%2BConfiguration#Configuration-of-Flight-Guidance-%26-Sensor-Release-Configuration-options.
Local coordinates can be displayed by Leica FlightPro if transformation parameters from WGS84 to local coordinates are available. This is the case, if either the flight plan was made in Leica MissionPro or later in local coordinates or if a map with local coordinates is displayed in the map layer. If both is the case, Leica FlightPro always applies the transformation valid for the flight plan
North-up navigation control
This control is the key element of the North-up view. See section https://hexagon.atlassian.net/wiki/spaces/FPDOC/pages/45283804009/6.3.1%2B2%2BSoftware%2BGlobal1%2BConfiguration#Configuration-of-Flight-Guidance-%26-Sensor-Release-Configuration-options.
The examples below show the North-up control surrounded by the wind control, the track and line direction control, the track deviation control and the position control.
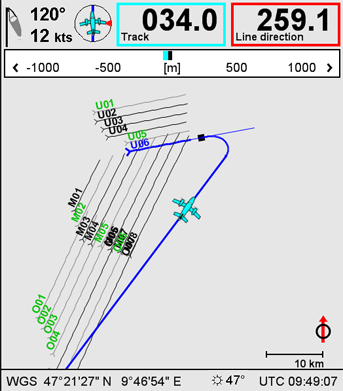
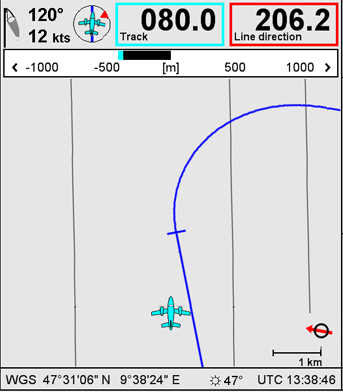
This control displays a project overview in North-up orientation. Flight guidance information is optimized for approaches and turns. The example shows the control during approach to the line.
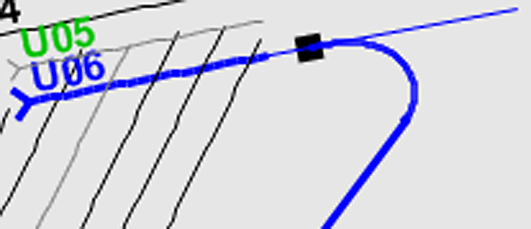
The detail above shows the suggested approach to the IP. The line approach is opposite to the planned direction.
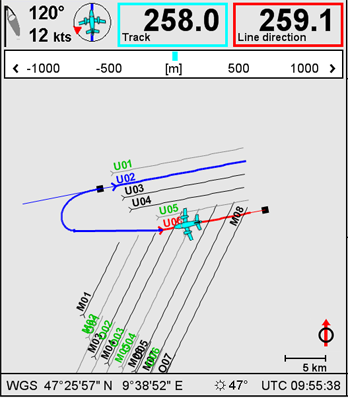
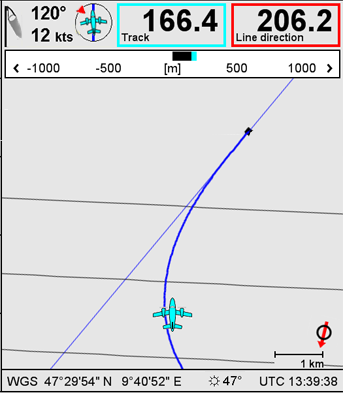
The example shows the control during line execution. The next line (blue) is already pre-selected.
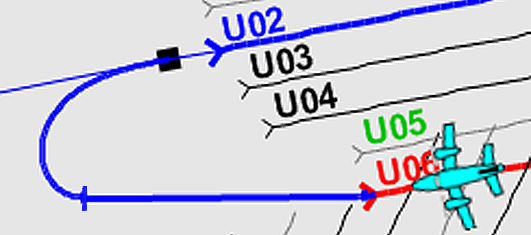
The detail above shows the aircraft along the line (red), the suggested flight path to the next line which will be approached in the planned direction.
The line direction according to the flight planning is indicated by a fork at the starting point of a line. The line label is displayed at the same side of the line. The examples above show, that a line can be flown in either direction, as planned or in the opposite direction.
Nose-up navigation control
This control is the key element of the Nose-up view. See section https://hexagon.atlassian.net/wiki/spaces/FPDOC/pages/45283475885/6.3.1%2B2%2BFlight%2BGuidance%2BViews#Nose-up-view. The examples below show the Nose-up navigation control surrounded by the wind control, the track and line direction control, the track deviation control and the position control.
This control is optimized for the pilot. It provides graphic flight guidance information during approaches and turns. The orientation is Nose-up. North direction is indicated on the lower right corner of the control.
The example shows the aircraft position on the right side of the optimal approach path. The lateral deviation is about 400m.
The optimum approach path will require a right turn. The aircraft is already close to that turn. A cross bar indicates the transition point from the straight flight path to the turn part of the optimum approach.
The pilot should start the turn just before the cross bar passes the nose of the aircraft icon.
The example shows the aircraft already close to the IP. The aircraft position is on the right side of the optimum flight path. The lateral deviation is about 100 m.
A fictive line is displayed in thin blue. This is the extension of the flight line towards IP and approach. This line is an aid for the pilot during the final approach to the IP. It allows to identify whether the aircraft is on the left side or right side of the line.
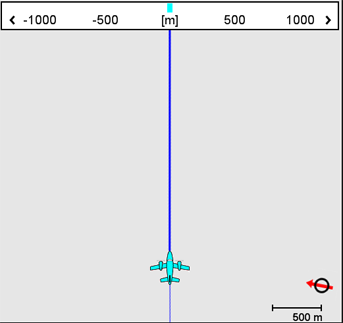
The example on the left shows the nose-up navigation control with the track deviation control.
The aircraft flies precisely along the suggested flight path. The track deviation control shows no lateral deviation.
Line deviation control
The line deviation control shows the lateral deviation of the line from the aircraft’s current position. Units are shown in the control. This control is part of the in-line navigation control. For more information see section https://hexagon.atlassian.net/wiki/spaces/FPDOC/pages/45283475885/6.3.1%2B2%2BFlight%2BGuidance%2BViews#In-line-view.
Important: A flight line must be selected before the line deviation control will display information
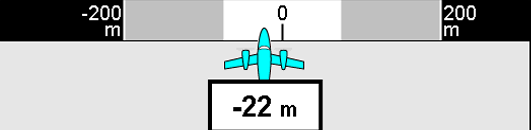
The deviation is -22 m.
Seen from the aircraft position the line is 22 m on the right side.
Seen from the planned line position, the aircraft is 22 m on the left side.
Configuration of the line deviation control see section https://hexagon.atlassian.net/wiki/spaces/FPDOC/pages/45283804009/6.3.1%2B2%2BSoftware%2BGlobal1%2BConfiguration#Sensor-Release-Control.
In-line navigation control
This control is the key element of the In-line view. See section on https://hexagon.atlassian.net/wiki/spaces/FPDOC/pages/45283475885/6.3.1%2B2%2BFlight%2BGuidance%2BViews#In-line-view. The examples below show the In-line navigation control surrounded by the wind control, the track and line direction control and the position control. The line deviation control is incorporated.
The in-line navigation control is optimized for the pilot. It provides graphic flight guidance information during line execution.
This control is optimized for the pilot. It provides graphic flight guidance information during line execution.
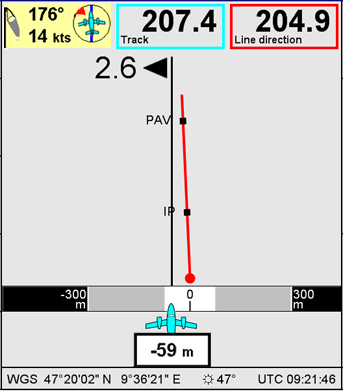
The example on the left shows the aircraft position just before reaching the IP. Also the PAV IP is just ahead in time.
The red line with the circle shows relative position and direction of the line to be executed.
The planned line is 59 m to the right side of the aircraft’s position. The offset is still tolerable. It is in the ‘white’ range.
The difference of true track and line direction is about 2.6°
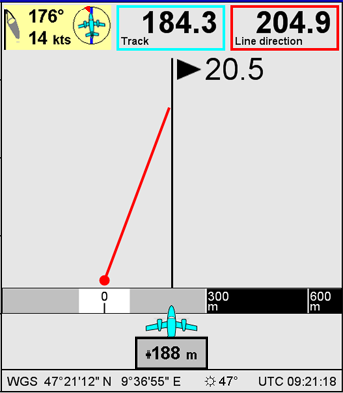
The example on the left shows a typical final approach to the line. The aircraft is flying the final turn to the IP.
The line is about 188 m to the left side of the aircraft. The offset is in the warning range.
The difference between the true track and the line direction is 20.5°.
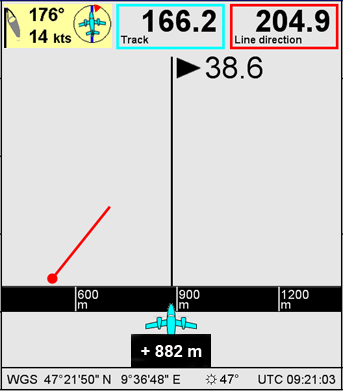
The example to the left shows the approach to the line with a large lateral offset.
The line is about 882 m on the left side of the aircraft. The offset is in the release shut-off range.
The difference between the true track and the line direction is 38.6°
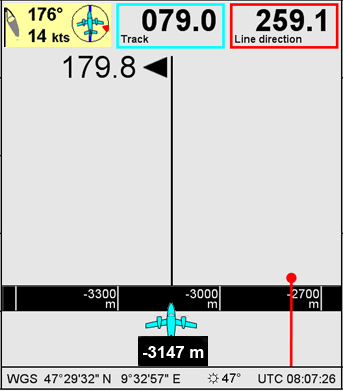
The example on the left shows the approach to the line if the line direction is opposite to the current track.
The line is about 3147 m to the right side of the aircraft.
The relative position of the line to the aircraft is shown in the Aircraft to target control. See section https://hexagon.atlassian.net/wiki/spaces/FPDOC/pages/45283410168/6.3.1+Flight+guidance+controls#Aircraft-to-target-control.
3-D Navigation control
This control is the key element of the 3-D Navigation view. It provides graphic and numeric information for flight guidance. See section https://hexagon.atlassian.net/wiki/spaces/FPDOC/pages/45283475885/6.3.1%2B2%2BFlight%2BGuidance%2BViews#3-D-Navigation-view.
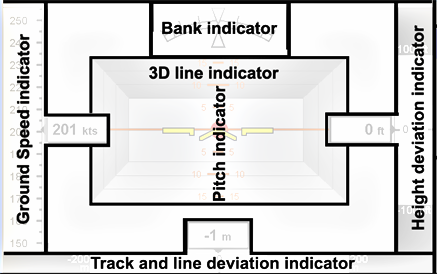
Bank indicator and Pitch indicator: display of information provided by the NovAtel SPAN system.
Track and line deviation indicator
-
During approached and turns: displays the deviation from the suggested flight path.
-
Along the line: displays the deviation to the line.
Height deviation indicator: displays desired ALT MSL. Similar as the flying altitude control
Ground speed indicator: displays the current and target GS. Similar as the speed control
Important: Bank and pitch indicator are only displayed if the NovAtel SPAN system is in the mode 'Full Navigation'. If the sensor mount is installed with an attitude angle, the pitch information will be different to the aircraft's pitch.
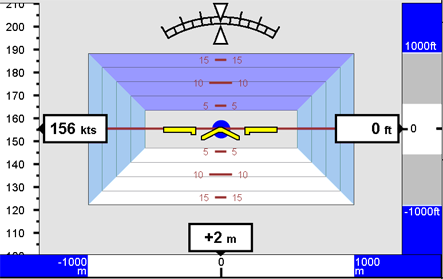
3-D Navigation control during approach
During this phase of the flight mission the control appears mainly in blue colour. The target dot is displayed in blue as well
-
The 3D line indicator (tunnel) appears symmetrically. This is the case if the approach direction is a straight line
-
The ground speed indicator shows a GS of 156 kts.
-
The bank indicator shows a roll angle of zero.
-
The pitch indicator shows a pitch value of zero.
-
The track and line deviation indicator shows a deviation of +2m. The value is displayed on white background which indicates that the deviation can be ignored. The limit can be configured in Leica FlightPro.
-
The height deviation indicator shows a deviation of 0 ft. This is the case if the aircraft is flying at desired altitude. The value is displayed on white background. This is the case if the deviation can be ignored.
-
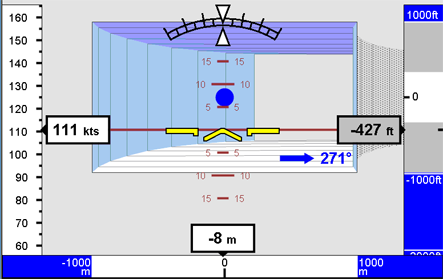
The 3D line indicator appears as a tube turned to the right side. This is the case if the aircraft should fly a right turn during the approach. The turn will end if the aircraft's heading is 271°.
-
The ground speed indicator shows a GS of 111 kts.
-
The bank indicator displays a roll angle of zero.
-
The pitch indicator displays a pitch angle of zero. The aircraft is levelled.
-
The track and line deviation indicator shows a deviation of -8m. The value is displayed on white background which indicates that the deviation can be ignored. The limit can be configured in Leica FlightPro.
-
The height deviation indicator shows a deviation of -427ft. The value is displayed on grey background which indicates that the deviation should be corrected. The limit can be configured in Leica FlightPro.
-
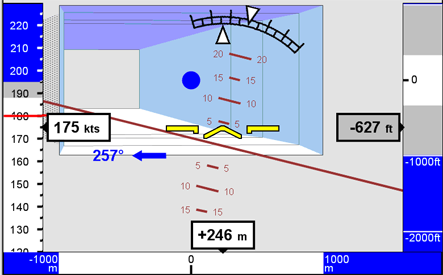
The 3D line indicator appears as a tube turned to the left side. This is the case if the aircraft should fly a left turn during the approach. The turn will end if the aircraft's heading is 257°.
-
The ground speed indicator shows a target GS of 180 kts and an aircraft GS of 175 kts.
-
The bank indicator displays a roll angle of about -14°. The aircraft is turning left.
-
The pitch indicator displays a pitch angle of about +4°. The aircraft is climbing.
-
The track and line deviation indicator shows a deviation of +246m. The value is displayed on white background which indicates that the deviation can be ignored. The limit can be configured in Leica FlightPro.
-
The height deviation indicator shows a deviation of -627ft. The value is displayed on grey background which indicates that the deviation should be corrected. The limit can be configured in Leica FlightPro.
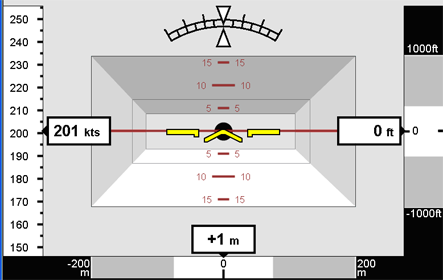
3-D Navigation control along the line
During this phase of the flight mission the control appears mainly in grey/black color. The target dot is displayed in black and if recording is ON it is displayed in red.
-
The 3D line indicator (tube) appears symmetrically. This is the case if the planned flight line is a straight line.
-
The height deviation indicator shows a deviation of 0 ft. White background indicates that the deviation can be ignored. Grey background indicates that the deviation should be corrected. Black background indicates that it is out of limit. The limits can be configured in Leica FlightPro.
-
The bank indicator displays a roll angle of 0°.
-
The pitch indicator displays a pitch angle of 0°.
-
The aircraft is on the final approach to the line. The sensor is not recording. The target dot is displayed in black.
-
The track and line deviation indicator shows a deviation of +1m. The value is displayed on white background which indicates that the deviation can be ignored. The limit can be configured in Leica FlightPro.
-
The ground speed indicator shows an aircraft GS of 201 kts.
-
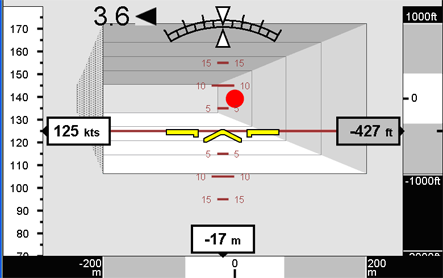
The 3D line indicator appears twisted to the left. This is the case if the aircraft track is not aligned with the line direction.
-
The ground speed indicator shows an aircraft GS of 125 kts.
-
The track correction would be 3.6° to the left.
-
The pitch indicator displays a pitch angle of 0.
-
The bank indicator displays a roll angle of 0°.
-
The sensor is recording. The target dot is displayed in red.
-
The track and line deviation indicator shows a deviation of -17m. The value is displayed on white background which indicates that the deviation can be ignored. The limit can be configured in Leica FlightPro.
-
The height deviation indicator shows a deviation of -427 ft. Grey background indicates that the deviation should be corrected. The limits can be configured in Leica FlightPro.
-
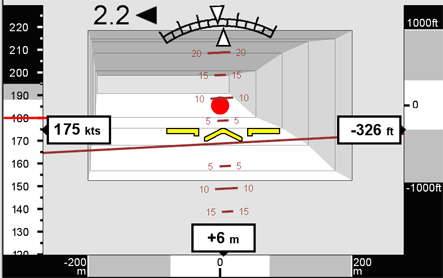
The 3D line indicator appears twisted to the left. This is the case if the aircraft track is not aligned with the line direction.
-
The ground speed indicator shows a target GS of 180 kts and an aircraft GS of 175 kts.
-
The track correction should be 2.2° to the left.
-
The bank indicator displays a roll angle of about +3°.
-
The sensor is recording. The target dot is displayed in red.
-
The pitch indicator displays a pitch angle of about +2°.
-
The track and line deviation indicator shows a deviation of +6 m. The value is displayed on white background which indicates that the deviation can be ignored. The limit can be configured in Leica FlightPro.
-
The height deviation indicator shows a deviation of -326 ft. White background indicates that the deviation can be ignored. The limits can be configured in Leica FlightPro.
Real-time view control
This control is the key element of the Real-time view. See section https://hexagon.atlassian.net/wiki/x/gQAwago.
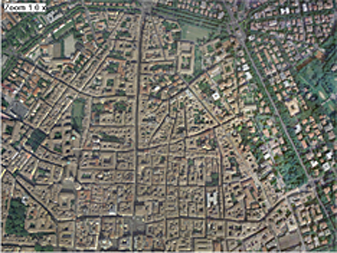
The Real-time view control displays the thumbnail images.
During flight execution, the Real-time view allows to compare the track of a flight line with the position of the flight line on a map. In case the transformation parameters have been wrongly set during flight planning, the track of the flight line will not coincide with the flight line on the map.
The Real-time view is for checking purposes only.
Flying altitude control
Important: The flying altitude control shows as desired altitude always ALT MSL regardless of the target height mode configuration. See https://hexagon.atlassian.net/wiki/spaces/FPDOC/pages/45283804009/6.3.1%2B2%2BSoftware%2BGlobal1%2BConfiguration#Configuration-of-Flight-Guidance-%26-Sensor-Release-Configuration-options.
Important: All altitude data are referenced to ellipsoidal height WGS84.
Desired altitude
-
Target height mode: ALT MSL - flying at constant altitude
The desired altitude for the flight line is taken from the flight plan or in case of manual operation of the Leica RCD30 it is taken from the Height, Altitude and GSD configuration.
-
Target height mode: ALT AGL - following terrain mode
When flying along the line the desired altitude is permanently updated according to the height profile stored in the flight plan.
The flying altitude control shows the desired altitude in a red frame. The background colour depends on the target Height mode configuration. In case of ALT MSL the background colour is yellow. In case of ALT AGL the background colour is grey.
The current altitude is shown on a cyan background. The current altitude source depends on the target Height mode configuration. In case of ALT MSL the source is the GNSS. The mode ALT AGL is implemented as option for the Leica ALS80. In this case the source is the Leica ALS80 LIDAR data.
The difference between the desired and current altitude is shown in black. The vertical bar in the centre of the control indicates in grey the vertical warning and in black the vertical release shutoff range. See configuration in section See https://hexagon.atlassian.net/wiki/spaces/FPDOC/pages/45283804009/6.3.1%2B2%2BSoftware%2BGlobal1%2BConfiguration#Configuration-of-Flight-Guidance-%26-Sensor-Release-Configuration-options.
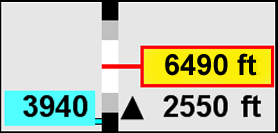
Current flying altitude is 3,940 ft.
Desired flying altitude is 6,490 ft. (ALT MSL).
The aircraft should climb 2,550 ft.
The aircraft altitude indicator points to the black range. That is, the aircraft is flying outside the specified vertical sensor release range.
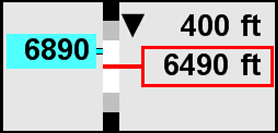
Current flying altitude is 6,890 ft.
Desired flying altitude is 6,490 ft. (ALT AGL).
The aircraft should descend 400 ft.
The aircraft altitude indicator points to the white range. That is, the aircraft is flying within the specified sensor release tolerance.
Aircraft to target control
This control shows the relative position of the next line to the aircraft. The information displayed depends on the line status:
-
If no line is selected, the control displays no information.
-
If a line is selected, the information is displayed as given in Figure 179 below.
-
If the IP is passed, the information given in the control is valid for the pre-selected next line.
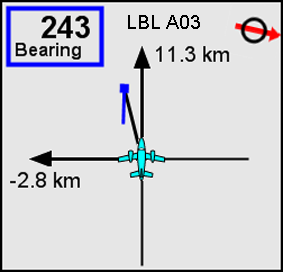
The orientation is Nose-up. North direction is indicated in the upper right section.
The relative position of the IP to the aircraft and the Line direction relative to the aircraft are graphically displayed. The x- and y-offsets to the IP are numerically displayed.
The Bearing to the IP is displayed in degrees.
The information is valid for the line labelled (numbered) ‘A03'
Line progress control
Note: A flight line must be selected that the line progress control can display full information. For a non-planned line the line progress control shows only limited information.
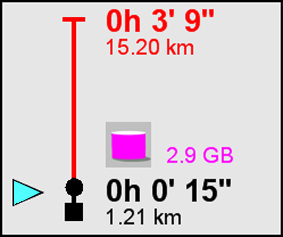
The line progress control provides information about progress in line execution. The information is colour coded. See also section https://hexagon.atlassian.net/wiki/spaces/FPDOC/pages/45283410168/6.3.1+Flight+guidance+controls#Colour-codes-in-the-flight-guidance-control.
Note: Leica FlightPro can be configured to display the Line progress control optimized for the pilot. In this case only the time and the distance to IP or line start respectively and the time and distance to the line end will be displayed. How to configure see section "Configuration of global parameters ‘Units’" in Volume 3, Chapter 4 on Page 548.
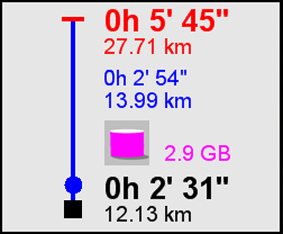
Red: Time required to fly from current position along the suggested flight path to the end of the line. Length of suggested flight path.
Blue: Time needed to fly at current GS along the line. Line length.
Red: Number of frames to be taken on the line.
Black: Time required to fly from current position along the suggested flight path to the IP. Length of suggested flight path.
Red: Time required to fly from current position to the end of the line. Distance from current position to the end of the line.
Red: Number of frames to be taken on the line.
Black: Time required to fly from current position along the suggested flight path to the IP. Length of suggested flight path.
Cyan triangle: Indicates aircraft position before IP
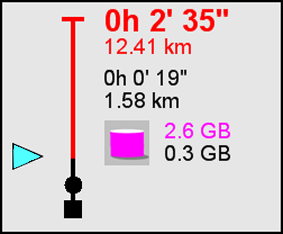
Red: Time required to fly from current position to the end of the line. Distance from current position to the end of the line.
Red: Remaining frames to complete the line.
Black: Amount of frames taken along the line.
Cyan triangle: Indicates aircraft position along the line.
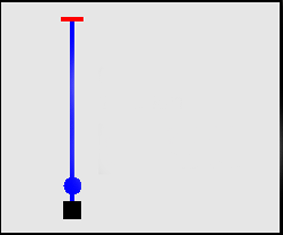
No information displayed because no line is selected.
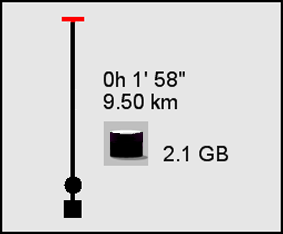
Black: Time and distance flown since release start.
Black: Number of frames fired since release start.
Speed control
Important: The speed control shows only correct data if height, altitude and GSD are correctly configured. For manual operation the configuration has to be made by the user in the Height, altitude and GSD dialog. If a planned flight line is selected, the data are taken from the flight plan and automatically configured by Leica FlightPro.
The speed control shows the target GS for the line in a red frame. Additionally it shows information which depends on the flight status, whether the aircraft is on the approach to a line or flying along the line. All this aircraft speed information is shown on a cyan background.
Speed control for frame sensor
In this configuration the speed control displays the current GS and the maximum GS. The maximum GS is computed in-flight by Leica FlightPro based on the shortest base length on a line and the shortest cycle time of the Leica RCD30.
Important: To avoid lost photographs along the line do not exceed the maximum GS.
Note: Depending on the aircraft type and the GSD of the photographs, the indicated maximum GS can be faster than the aircraft is able to fly. The indicated maximum GS just gives the GS limit which shall not be exceeded. With a frame sensor it is always possible without restrictions to fly along the line slower than the maximum GS.
Examples of speed control for frame sensor:
Line is selected, the aircraft is approaching the line. Current GS is 156 kts Maximum speed is 230 kts.
Line is selected, the aircraft is flying along the line. The green check mark indicates that the current GS is less than 90% of the maximum GS of 210 kts.
Line is selected, the aircraft is flying along the line. A parachute indicates that the current GS of 150 kts is within 90% and 99% of the maximum GS which is 158 kts.
Line is selected, the aircraft is flying along the line. Warning: current GS of 154 kts exceeds the limit for GS which is 151 kts.