Image Adjustment Tool
The radiometry of an image results from the raw values recorded, any statistical corrections computed during data ingest and a radiometric profile applied, defining the transformation from the raw data into final imagery bit depth.
It is possible to visualize imagery in the map view without having a radiometric profile defined. An auto-stretch option allows to compute and apply a temporary radiometry correction that brings the otherwise dark imagery to a viewable dynamic range.
If we now want to create a user-defined radiometric profile it is therefore important to first disable this auto-stretch function. This allows to directly preview the effect of the defined transformation inside the image QC viewer.
Using the Image Adjustment Tool
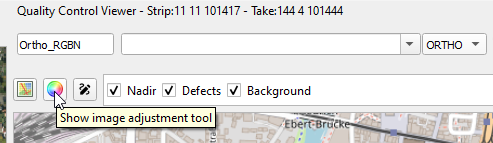
To use the image adjustment tool imagery data needs first to be loaded into the image QC viewer. This can be done by either using the context menu of a take or using the Ctrl+DoubleClick shortcut in the mapview.
Once loaded the image adjustment tool can be launched using the corresponding toolbar option.
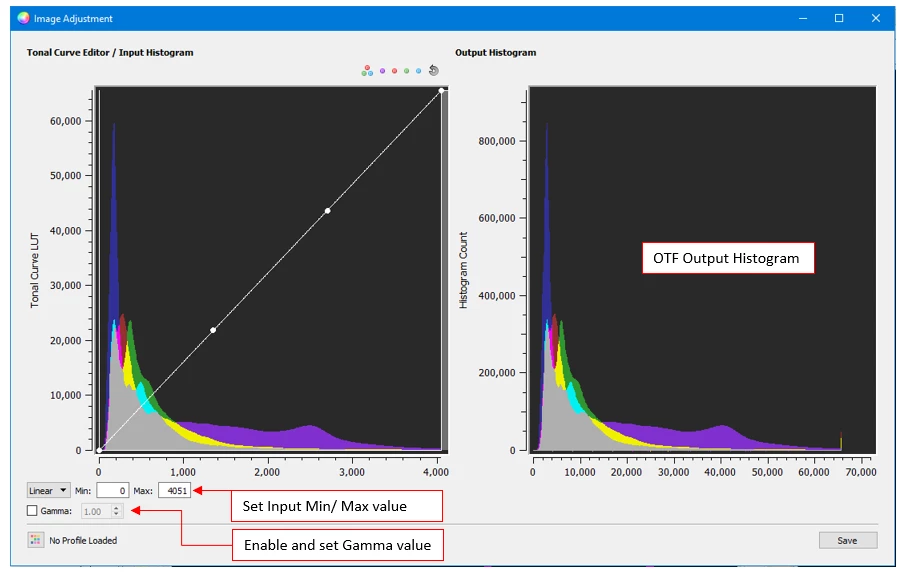
The Image Adjustment tool displays at first a representation of the histograms per channel stretching over an auto-calculated range of min/ max grey value available in the shown band combination. This range is displayed as well in the Min/ Max fields.
The following scheme show the Image Adjustment dialog immediately after launch. The left side shows the input histogram and gives access to the curve editor. The right side shows an on-the-fly output histogram.
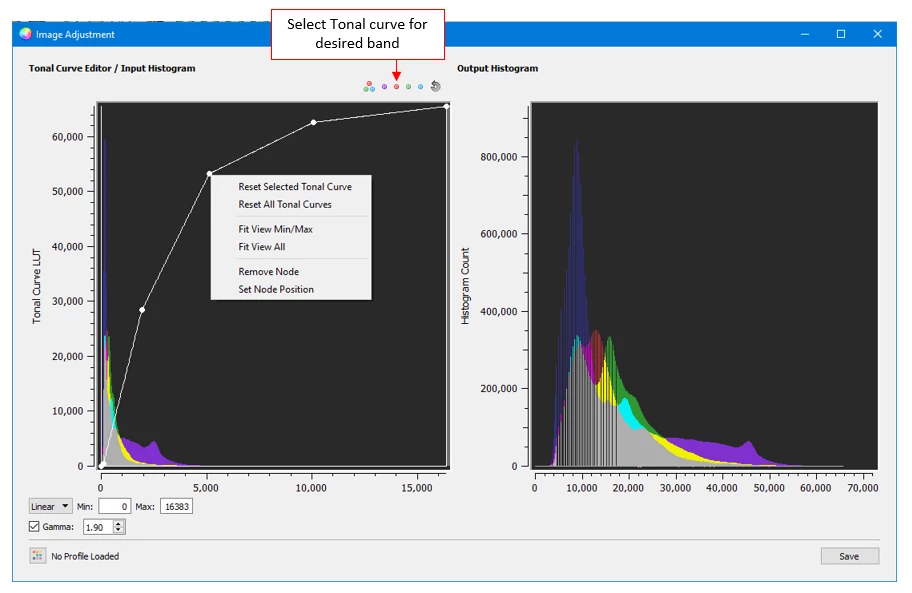
The dialog allows the following interaction:
Zoom in/ out: draw zoom window/ right double-click
Reset selected Tonal Curve: currently active tonal curve is set back to inital status (if no specific band was selected) or to average curve (if a specific band was selected)
Reset All Tonal Curves: tonal curves for all bands are set back to initial status
Fit View Min/Max: Histogram is fit into specified Min/ Max grey values
Fit View All: Histogram is fit into grey value range as given by bit depth
Add Node: point is added on cursor position (option available, if pocket menu is launched on curve)
Remove Node: point is deleted (option available, if pocket menu is launched close to existing point)
Set node position: allows to enter new DN value for selected node
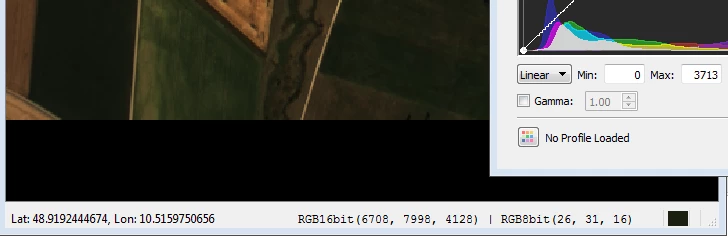
Beside visual inspection of the effects triggered by curve editing, the QC Viewer lists the specific given grey values for any point at the cursors position mapped to a 16b and 8b grey value range:
If the results of histogram modification are satisfying, use the Save button to store the radiometric profile at any desired location.
Close the Image Adjustment tool and move to any other image you wish to review. If the next image is displayed in the QC Viewer, you are able to open the Image Adjustment tool again and to load the previously generated radiometric profile to verify its effect on a different image.
Preview Radiometric Profile
Once the user has determined a satisfying radiometric profile on a specific image, its effect on strips or the whole session should be reviewed. This helps to find out if fine-tuning is required or one radiometric profile produces an overall satisfying radiometric result for a complete session.
To perform this verification, select an entity in the Data Source Tree (e.g. Strip or Session) and perform a right mouse-click. This enables a context menu:
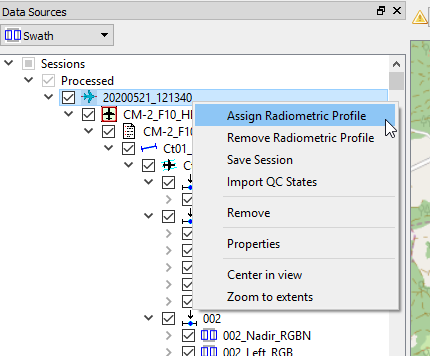
The pocket menu allows to assign (but also to remove) a previously generated radiometric profile to the selection. Browse for the desired *.xml file and confirm. The Mapview will update the selected items on the fly, while the selected data source gets internally linked with the specified profile, so that it later on can easily be used for Product Generation.
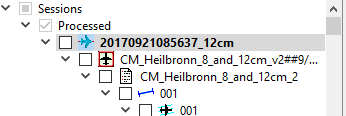
Once a radiometric profile has been assigned, the source tree item used for the assignment is displayed in a bolded fashion to indicate, that radiometric profile is linked.
Note
Currently it is only possible to link one radiometric profile to a selection. If you intend to setup radiometric profiles for more than one product, the suggested workflow is
display the first product (e.g. RGBN) you wish to enhance
define the radiometric profile
assign it to session/ strips etc.
define a block to be used for product generation (see next chapter). The assigned radiometric profile gets passed to this block
Now remove the previous radiometric profile(s)
repeat steps 1-3 for the second product (e.g. PAN)
define a 2nd block. The newly assigned radiometric profile gets passed to this 2nd block only.