Take-Off control
The Take-Off control gives information about the status of the system during start-up, whether it is ready or not for take off.
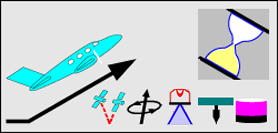
As long as the system is not ready for the flight an hour glass symbol is displayed on the upper right side of the control.
The hour glass is replaced by a check mark symbol if all components of the system are ready. After remaining in this state for a few seconds the Take-Off control is replaced by the Sensor control
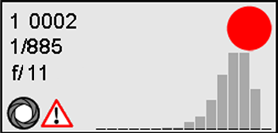
Image Sensor control
The Sensor control gives information about the cameras in the system. It displays:
-
Camera identifier (Camera 1 or 2)
-
Camera image counter (Four digits or more)
-
Shutter time (Time used for the last or associated photograph)
-
f-number (Value used for the last or associated photograph)
-
Operational mode of exposure setting (Automatic or Manual)
-
User applied exposure setting time corrections (only if in Automatic exposure setting mode)
-
Underexposure and overexposure warning symbols
-
Red dot during the time a series of photographs is fired
-
Turning hourglass during the time additional images are captured to adjust the exposure setting for the Automatic exposure setting mode
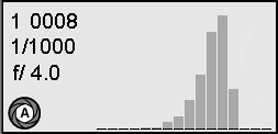
1 = Camera identifier. The identifier can be as follows:
1 = camera #1, 2 = camera # 2
N = Nadir, F = Forward, B = Backward, L = Left, R = Right
0008 = Camera counter
1/1000 = exposure time
f/4.0 = f-number
A on white background = Automatic exposure setting mode
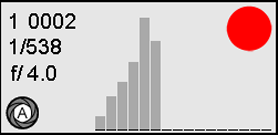
Red dot = release sequence ongoing
Graphics with bars = histogram classes of current photograph

ST on yellow background in the icon on the lower left corner indicates that the settings adjusted by the automatic integration time control are frozen.
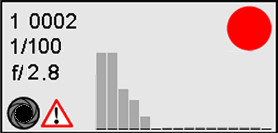
Diaphragm with black centre and warning symbol on the lower left corner indicates that the images are underexposed. The image quality will be poor.
The graphics show only bars for the histogram classes with low integration (bars mainly shown on the left side within the range).
Diaphragm with white centre and warning symbol on the lower left corner indicates that the images are overexposed.
The image quality will be poor.
The graphics shows only bars for the histogram classes with high integration. (Bars mainly shown on the left side within the range).
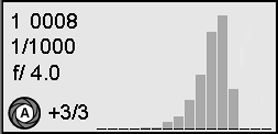
Value displayed on the right side of the AutoIT icon on the lower left corner (in this example +3/3) indicates that the user has applied an exposure time correction.
+ correction results in a brighter image.
- correction results in darker image.
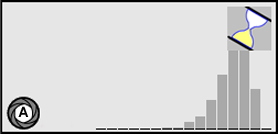
Turning hourglass on the upper right side of the control. This indicates that the Automatic Integration Time control loop is adjusting the exposure settings (Gain and Shutter time).
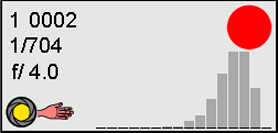
Diaphragm with yellow centre and hand symbol on the right side displayed on the lower left corner. This indicates that the user has manually set the exposure settings (Shutter speed and diaphragm size).
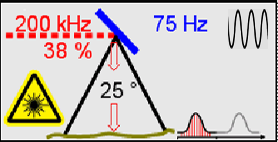
LiDAR Sensor control
The LiDAR Sensor control gives information about the Hyperion LiDAR Units.
Actual Laser Pulse Rate is 158 kHz
Actual Laser Output is 57%
Actual Scan Rate is 52 Hz
Sine laser pattern
Field of View is 40°
MPiA option is OFF - only one vertical arrow displayed
Laser is firing - laser warning symbol is displayed constantly on
Shutter is closed - vertical arrow is displayed with red borders
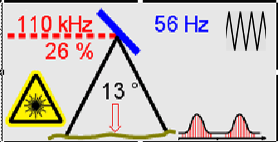
Actual Laser Pulse Rate is 158 kHz
Actual Laser Output is 57%
Actual Scan Rate is 52 Hz
Triangle laser patter
Field of View is 40°
MPiA option is ON - two vertical arrows displayed
Laser is firing - laser warning symbol is displayed constantly on
Shutter is closed - vertical arrow is displayed with red borders
Raster laser pattern
MPiA function is activated. This is indicated by the two downward-pointing arrows.
Shutter is open- Vertical arrows are now displayed in solid red and the yellow laser warning symbol is blinking
System in MPiA mode once the aircraft has reached the correct point to begin scanner data recording. In this example, sensor settings are as in Figure 63, except that the MPiA function is activated. This is indicated by the two downward-pointing arrows.
Data recording is ON - As indicated by the red blinking dot
FWD option is enabled in sub-sample mode. This is indicated by the icon located on the lower right corner of the control.
Sub-sample mode will occur if the laser pulse rate is greater than the maximum FWD rate for the selected configuration.
FWD option is enabled in full sampling mode. This is indicated by the icon located on the lower right corner of the control.
Full sampling mode will occur if the laser pulse rate is less than or equal to the maximum FWD rat for the selected configuration.
Range and Height control
The Range and Height control displays flying height, range gate and eye safe range information.
Minimum range gate is 1139 m
Eye safety auto shutoff is set for class I emission level when used with binoculars.
Auto shutoff is set for 1279 m
Maximum range gate is 1464 m
Current flying height is 839 m
Distance from current range to minimum range gate is 90 m
Distance from current range to maximum range gate is 97 m
Memory control
The memory control graphically displays the usage rate of the mass memory MM60/MM30. At the upper right, in magenta font numerical information is displayed about available mass memory space and the estimated recording time left. At the lower right, in black font used mass memory space and current sum of recording time is displayed.
Note: Available disk space is the space which could be allocated during memory initialization after [Flight] was selected or the MM60/MM30 was changed.
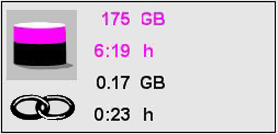
Joint operation
The icon displayed on the left side in the control shows a large barrel. This indicates mass memory mode ‘Joint operation’
This is the case, if two MM60/MM30 are inserted into the CC3x and the system is configured for joint operation.
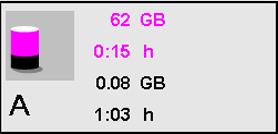
Single operation
The icon displayed on the left side in the control shows a small barrel. This indicates mass memory mode ‘Single operation’
This is the case, if one MM60/MM30 is inserted into the pod and Leica FlightPro is configured for single operation.
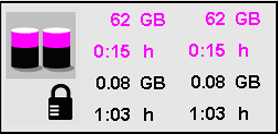
Backup operation
The icon displayed on the left side in the control shows two small barrels, below one funnel is a lock icon displayed. This indicates MM mode ‘Backup operation’.
This is the case, if two MM30 are inserted into the MM30 slots in the CC3x and the system is configured for backup operation.
GNSS/IMU control
The GNSS/IMU control shows status of the GNSS receiver, the number of satellites in view and the PDOP value.
The GNSS/IMU control also displays the Roll, Pitch and Drift angles of the aircraft, in degrees.
The Combined status of the GNSS/IMU system is shown in the bottom left corner.
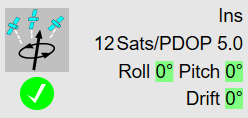
Navigation mode is in INS quality. Currently 12 satellites are in view PDOP is 5.0.
The Combined status of the GNSS/IMU system is shown in the bottom left corner and is taken from the https://hexagon.atlassian.net/wiki/spaces/FPDOC/pages/45283705445/6.3.1%2B2%2BSensor%2BStatus%2BViews#GNSS-IMU-status-view.
|
Combined status of the GNSS/IMU parameters |
Icon |
|---|---|
|
All parameters are green |
|
|
At least one or more parameters are yellow, and the rest of the parameters are green |
|
|
At least one or more parameters are red |
|
Pitch and Roll is given for the sensor’s aircraft frame.
If the aircraft rolls from horizontal anticlockwise, the roll value becomes negative. If the aircraft nose is lower than level, the pitch value is negative.
These Roll, Pitch and Drift values are shown with a coloured background. Depending on the orientation of the aircraft, the background colour for each attitude can change from green to orange to red. When a green or orange background is displayed, the PAV has enough range to compensate for the given attitude of the aircraft. A red background indicates to the pilot / operator that the mount compensation limits have been exceeded and that aircraft attitude should be adjusted.
|
PAV Range Attitude [%] |
Colour |
|---|---|
|
0% - 80% |
|
|
80% - 100% |
|
|
100% and more |
|
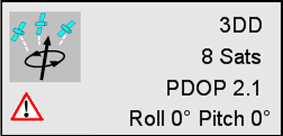
The warning symbol displayed on the lower left side indicates that the GNSS/IMU system is not yet in Full Navigation mode.
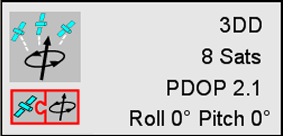
The deeply-coupled symbol appears on the lower left indicates that the GNSS/IMU hardware is capable to provide for navigation a deeply coupled real-time solution.